Query
This document mainly introduces how we can use the Slow query monitoring function provided by the software.
Move the mouse to the top menu Monitor and wait for the drop-down options to appear, click Query to enter the query monitoring interface, which is similar to the following page
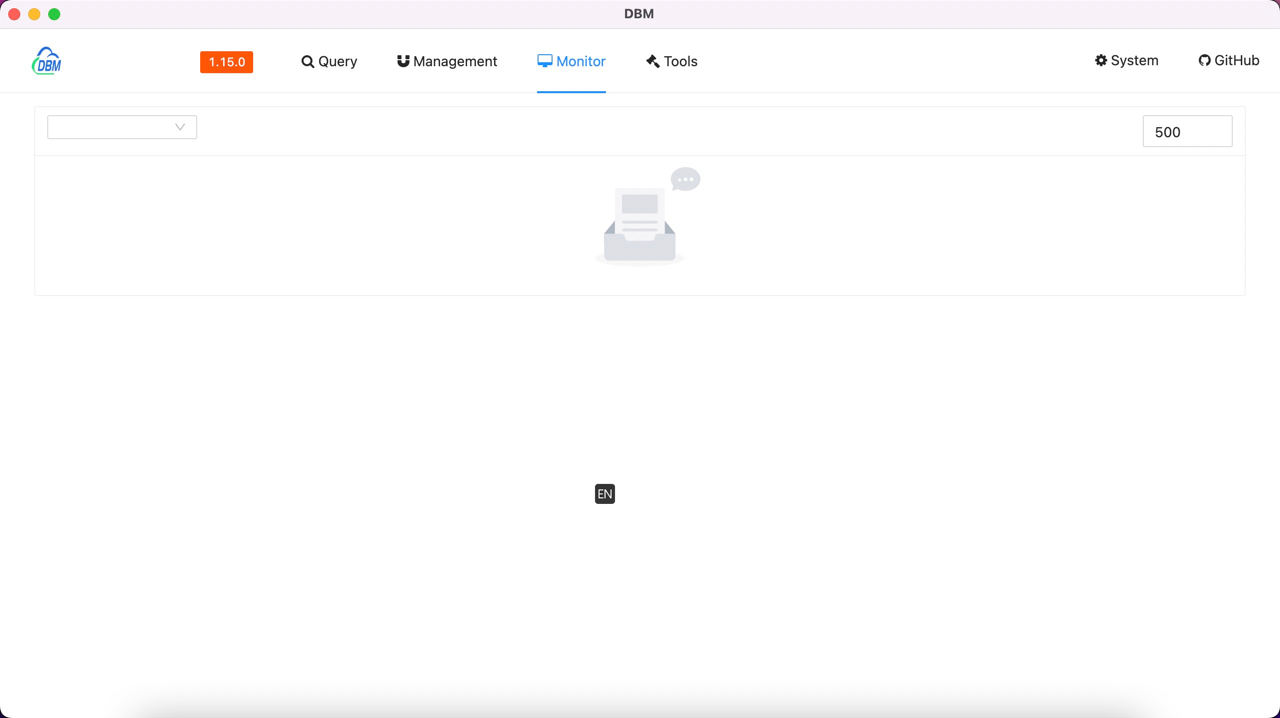
The upper part of the page is the data chart display & function configuration area, and the lower part is the detailed data list area
Data charting & Feature Configuration
The drop-down selection box on the top left is used to select the configured data source. After selection, the software will initiate a request to the service to obtain information, and return a data chart similar to the following
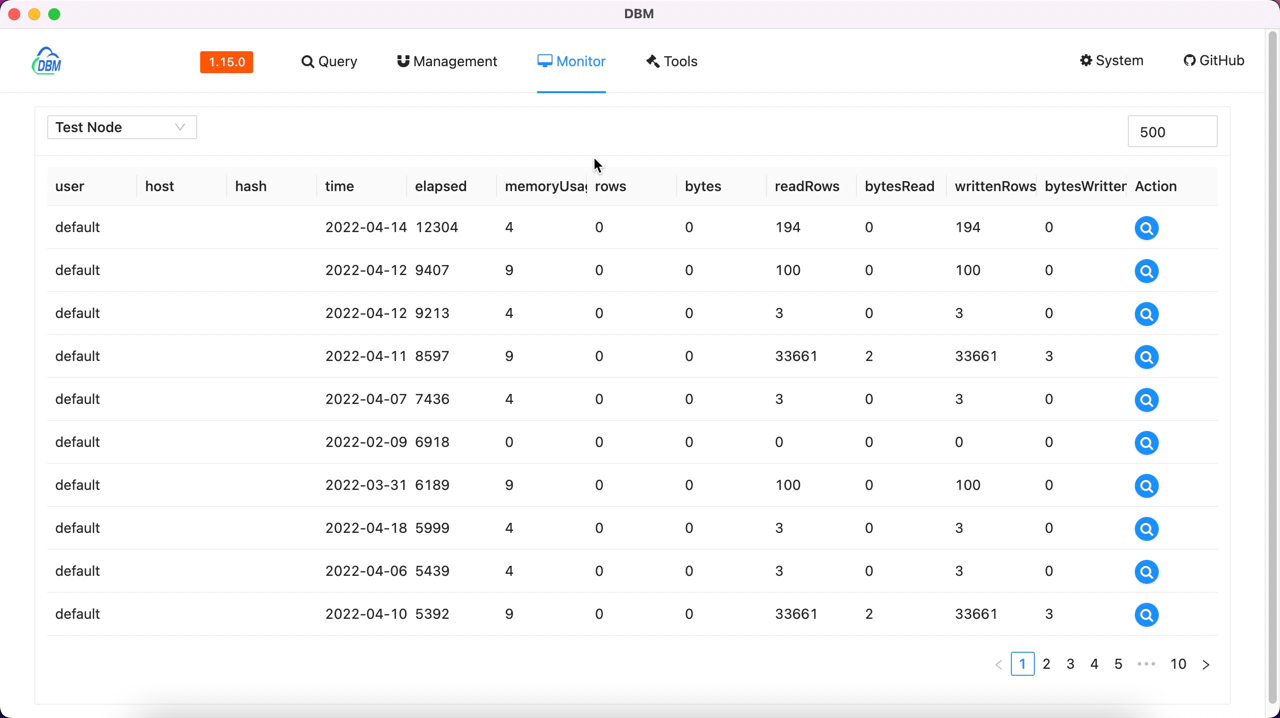
There is a Number input device at the top right
Numeric input is used to mark the maximum time-consuming limit of the query (unit: milliseconds)
Details of the data
The drop-down selection box on the top left is used to select the configured data source. After selection, the software will initiate a request to the service to obtain information, and return results similar to the following
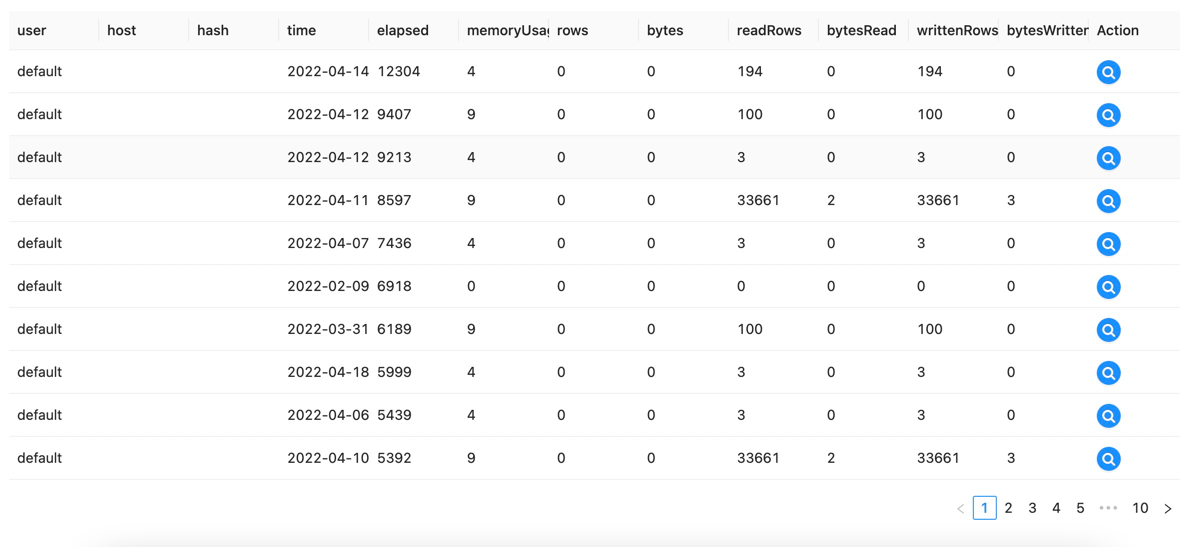
| Property | Description |
|---|---|
| user | Query the user used |
| host | Query the client host |
| hash | Query the generated hash data |
| time | Query creation time |
| elapsed(ms) | Query time (ms) |
| memoryUsage | Memory used by query |
| rows | Query the total number of rows |
| bytes | Total number of bytes queried |
| readRows | Query the total number of rows of read metadata |
| bytesRead | Query the total number of bytes of metadata read |
| writtenRows | The total number of bytes of metadata written to the query |
| bytesWritten | The total number of bytes of metadata written to the query |
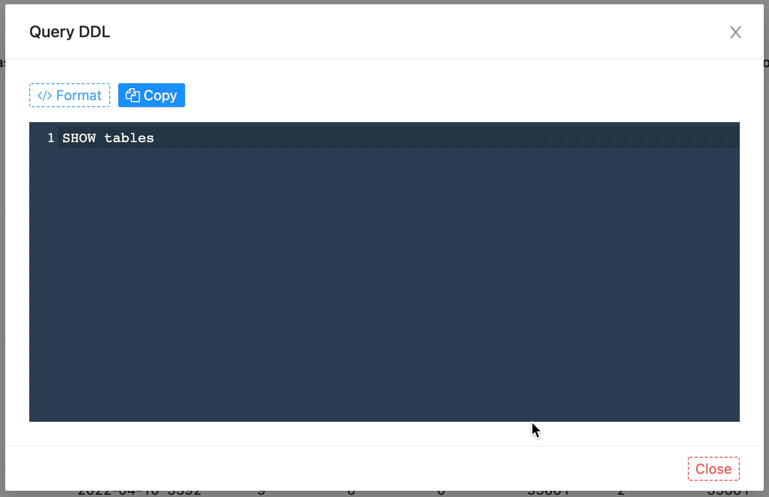
Action
button To query the DDL statement of the operation