Mutations
This document mainly introduces how we can use the Mutations monitoring function provided by the software.
Move the mouse to the top menu Monitor and wait for the drop-down options to appear, click Mutations to enter the connection monitoring interface, which is similar to the following page
The upper part of the page is the data chart display & function configuration area, and the lower part is the detailed data list area
Data charting & Feature Configuration
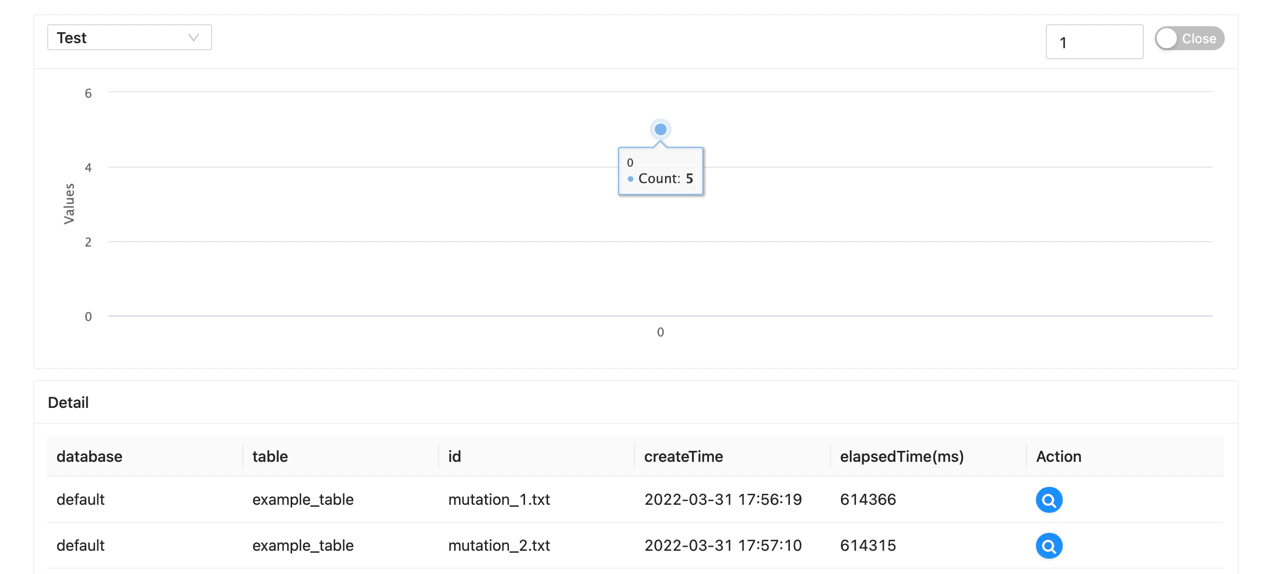
The drop-down selection box on the top left is used to select the configured data source. After selection, the software will initiate a request to the service to obtain information, and return a data chart similar to the following
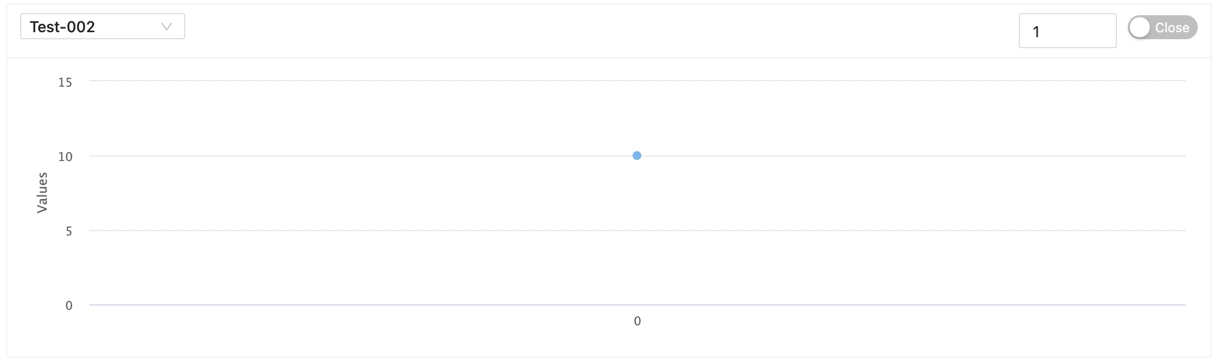
The graph shows the number of various active connections
On the top right side there is a Numeric and Selector
Numeric input is used to mark the split time of refresh data (unit: second)
The selector is used to mark whether to automatically refresh the data. When this option is turned on, the software will refresh the data according to the digital input data
Details of the data
The drop-down selection box on the top left is used to select the configured data source. After selection, the software will initiate a request to the service to obtain information, and return results similar to the following
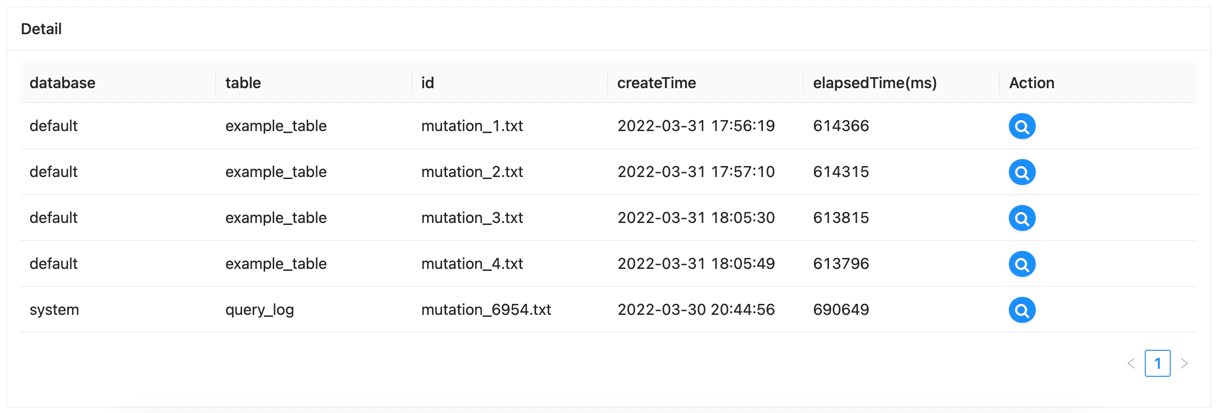
| Property | Description |
|---|---|
| database | Database of operations |
| table | Table of data for operation |
| id | The operations signature |
| createTime | Action creation time |
| elapsedTime(ms) | Operation time (ms) |
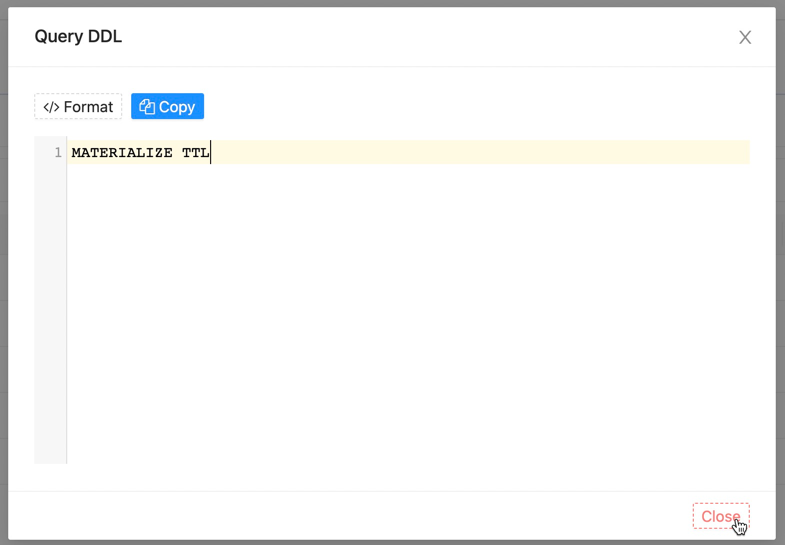
Action
button To query the DDL statement of the operation